
Create a Chart
Before you can create a chart, you must have a query for the data to use in the chart. An example of criteria for your query is an activity date greater than or equal to 1/1/2013. Select year received, member count, activity count, and sum of activity value as you output fields and sort by the year received field.
To create a new chart click Charts on the Navigation menu, click New Chart, and then follow these steps:
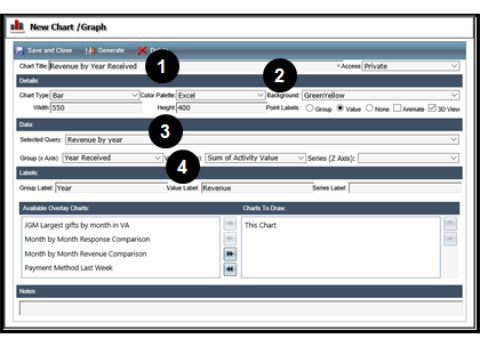
- Enter a name for your chart.
- Choose the details such as chart type, color palette to use, and background color for the chart.
- Select the query to use and then choose the criteria for the Group, Value, and Series fields.
- The fields available will change depending on the type of query used as the data source.
- Enter labels for the Group, Value, and Series fields.
- Click Generate.
- Make changes to the Details, Data, or Labels fields and preview the results until you achieve the look you want.
- Click Save and Close.
Looking at other charts is a good way to learn how charts are constructed. You can use an existing chart and change the name as well as some parameters to quickly create a new chart.
|
Copyright ©2017 Aegis Premier Solutions |